CHAPTER I
A CHANGING OCEAN ENVIRONMENT
A. CLIMATE CHANGE
During the past century, man has introduced greenhouse gases into the atmosphere that may cause extreme global consequences. The carbon dioxide (CO2) level today is estimated to be 30 percent above pre-industrial age levels. Paralleling this rise in CO2, the mean global surface air temperature is believed to have risen between 0.3 and 0.6=C since 1900. Scientists are not certain whether this temperature increase is caused by the increase in CO2, or is simply due to natural variation in the global climate. Nevertheless, the balance of evidence suggests that there is a discernible human influence on global climate.1
Our planet has the wrong name. Our ancestors named it Earth, after the land they found around them.. If the ancients had known what the earth is really like they undoubtedly would have named it Ocean after the tremendous areas of water that cover 70.8 percent of its surface. - Leonard Engel |
International efforts to limit greenhouse gases may have some impact on future release rates. However, CO2 has a long residual lifetime (about 100 years), and even if emissions of CO2 were reduced today it would still take centuries for its concentration in the atmosphere to decrease significantly. Attempts to limit CO2 emissions that result from the burning of traditional fossil fuels may have an effect on maritime operations similar to the effect of bans on Freon and other halocarbons, especially if new fuels and propulsion plants are mandated through legislation. |
B. IMPLICATIONS OF CLIMATE CHANGE
Maritime operations have always been susceptible to the effects of weather. The implications of a warming trend, then, must be examined in order to prepare for future operations. Among the impacts that a warming trend could have on global climate and weather patterns, which in turn could affect maritime operations, are changes to ocean currents, frequency and strength of oceanic storms, winds, frequency of fog, sea-ice distribution and thickness, and sea level rise.2
1. Global Warming
Global climate models predict that global temperatures will continue to rise. The "best estimate" values, as modeled by organizations contributing to the Intergovernmental Panel on Climate Change (IPCC), project an increase of about 2o C by 2100 in global mean surface air temperatures relative to 1990. Refining certain parameters in the model give a range of a 1 to 3.5oC increase, depending on the sensitivity of the climate to atmospheric aerosol composition and concentrations. By 2020, the IS92 model (considered "best estimate") global mean temperature is expected to increase by about 0.4oC. 3
2. Ocean Temperature
Due to the large heat capacity of water, the oceans can absorb a good deal of any atmospheric warming. However, much uncertainty exists relating to the impact of warmer air on complex global and hemispheric oceanic circulation. An important mechanism for distributing temperature extremes on the planet is thermohaline circulation. That is, at the poles, cold, saline water sinks to the bottom of the ocean basin, travels slowly toward the equator, and rises, thus cooling tropical waters. It is a combination of the vertical motion of the thermohaline circulation with wind-driven surface currents, which produces ocean currents.4
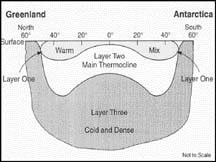
Figure I-1. Sea Water Stratification.5
The simulations of the climate model of the National Oceanic and Atmospheric Administration (NOAA) Geophysical Fluid Dynamics Laboratory (GFDL) project that the global thermohaline circulation will decrease in intensity as global warming occurs. This will be due to enhanced precipitation and runoff from the continents in high latitudes. The faster the build-up of CO2, the greater the eventual reduction in the thermohaline circulation and the longer the delay in its recovery.6 Some scientists believe the slowing of this circulation could result in dramatic temperature changes in coastal climates influenced by this circulation, such as Britain, Iceland, and the northeast United States. In addition, it could affect both living marine resources and the formation of mid-latitude storms/hurricanes.
3. Sea Level Rises
Over the past 100 years, global sea levels are estimated to have risen by about 5 to 25 cm, based on analyses of tide gauge records. The IS92 model (considered "best estimate") projects an increase in sea level of about 7 cm by 2020.7 Another recent research effort used the same IPCC model, adding refined forcing indices, and reproduced similar results at year 2020.8 Seawater thermal expansion, which is closely dependent on atmospheric warming, is the most significant cause of rising sea levels. Other factors changing sea levels include mountain glacier retreat and polar ice sheet ablation (erosion by melting) or accumulation.9
Even small increases in sea level can affect low-lying coastal areas and islands. The southern Atlantic and Gulf coasts, which are subsiding (sinking), are highly vulnerable. This is particularly true of southern Florida, where a third of the Everglades has an elevation of less than 12 inches10 (30 cm) above sea level. The Marshall Islands, one of the United States territories in the Pacific, lie almost entirely within three meters of sea level.
Cities close to sea level are being increasingly affected by subsidence due to overuse of groundwater. (High demand on underground aquifers can cause subsidence if aquifers are not allowed sufficient time to refill.) A rise in sea level could severely limit the regions available in densely populated areas for habitation and agriculture.11 Home ports for maritime forces located near these cities would also be affected.
a. Effects on Coastal Ecosystems
This anticipated rise in sea level would place stress upon coastal ecosystems. As a result, river deltas, estuaries, beaches, wetlands, coral reefs, mangrove forests, and sea grass beds may face degradation or eradication as new sea levels affect substrate,12 wave energy and bottom slope.13 This degradation will reduce or limit areas needed by living marine resources to reproduce and feed.
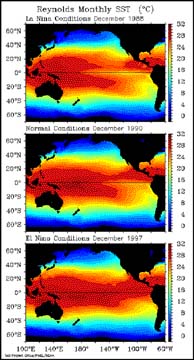
4. Storm Trends Warmer temperatures will lead to a more vigorous hydrological cycle. This translates into prospects for more severe droughts and/or floods in some places and less severe droughts and/or floods in other places. Knowledge is currently insufficient to say whether there will be any changes in the occurrence or geographical distribution of severe storms, such as tropical cyclones and mid-latitude storms. Evidence that the El Niño - Southern Oscillation (ENSO)14 has varied in period, recurrence interval, and area and strength of impact is found in historical instrumental data and in palaeoclimatic data. The cause of these variations is not known. The rather abrupt change in ENSO and atmospheric circulation around 1976-77 has continued. Since then, there have been relatively more frequent ENSO episodes, with only rare appearances of the La Niña15 phenomenon. This ENSO behavior since 1989 is unusual in the context of the last 120 years.16 Current knowledge of the ENSO phenomenon does not allow for accurate forecasting of future trends. However, research into ENSO and its effects has increased and may provide more information in the next ten years.17 |
Figure I-2. These graphics represent the sea surface temperature during La Niña, and El Niño. |
5. Ice Formation
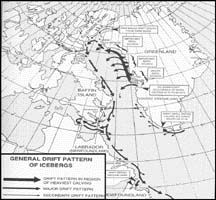
Of concern to mariners and scientists studying global warming is the affect of the warming upon the Arctic/Greenland and Antarctic ice sheets and glaciers. The threat is two-pronged; sea level rising and the iceberg danger to shipping.18
Figure I-3. Iceberg Routes to the North Atlantic.
Most of the non-oceanic water on Earth resides in the Greenland and Antarctic ice sheets, and most of its volume lies on land above sea level. Thus, loss of only a small fraction of this volume could have a significant effect on sea level. In Antarctica, temperatures are so low that very little surface melting occurs and the ice loss is mainly by iceberg "calving," the rates of which are determined by long term processes. In contrast, in Greenland, ice loss from surface melting and runoff is of the same order of magnitude as loss from iceberg calving. Consequently, climate change in Greenland could be expected to have immediate effects on the surface mass of the ice sheet through melting and runoff.19
C. UNCERTAINTIES STILL EXIST
Scientists studying climate change generally agree that there are still uncertainties in general circulation model (GCM) results. While there is agreement that the global climate will continue to change, exactly where and how these changes will be realized is not known. At this time, models cannot predict which continents will suffer or benefit from climate change. (Refer to Appendix C for further discussion.)
1
John Houghton and others, eds., Climate Change 1995, The Science of Climate Change, Summary for Policy Makers, Intergovernmental Panel on Climate Change (Cambridge, MA: Cambridge University Press, 1996), 10.2
Alan Robock, "Global Warming: State of the Science," Testimony before the House Committee on Science, Subcommittee on Energy and Environment, Oct 1997, 2.3
John Houghton and others, eds., Climate Change 1995, The Science of Climate Change, Summary for Policy Makers, Intergovernmental Panel on Climate Change (Cambridge, MA: Cambridge University Press, 1996), 45.4
George L. Pickard and William J. Emery, Descriptive Physical Oceanography (Oxford, United Kingdom: Pergamon Press Ltd., 1990).5
John M. Collins, Military Geography: For Professionals and the Public (Washington, D.C.: National Defense University Press, 1998), 49.6
U.S. Global Change Research Information Office, "Our Changing Planet: FY 1999", report from the USGC Research Program, 1998, accessed online, URL: http://www.gcrio.org/ocp99/ch2.html.7
John Houghton and others, eds., Climate Change 1995, The Science of Climate Change, Summary for Policy Makers, Intergovernmental Panel on Climate Change (Cambridge, MA: Cambridge University Press, 1996), 46.8
Thomas M.L. Wigley, "The Kyoto Protocol: CO2, CH4 and Climate Implications," Geophysical Research Letters, 25, (1998): 2285-2288.9
John Houghton, Global Warming: The Complete Briefing, 2nd Ed. (Cambridge, MA: Cambridge University Press, 1997), 109.10
White House Initiative, "Climate Change: State of Knowledge," 1998, accessed online, URL: http://www.whitehouse.gov/Initiatives/climate/next100-plain.html.11
John Houghton, Global Warming: The Complete Briefing, 2nd Ed. (Cambridge, MA: Cambridge University Press, 1997), 11412
Substrate refers to a surface on which plants or animals can grow or attach themselves to.13
George Maul, ed., Climatic Change in the Intra-American Sea (New York, NY, Edward Arnold, 1993).14
El Niño is an irregularly occurring flow of unusually warm surface water along the western coast of South America caused by diminishing or reversed prevailing east to west winds across the Southern Pacific. ENSO is accompanied by abnormally high rainfall in typically arid areas and also prevents upwelling of nutrient rich cold deepwater, causing a decline in regional fish populations.15
La Niña and El Niño are opposite phases of the ENSO cycle, with La Niña sometimes referred to as the cold phase of ENSO and El Niño as the warm phase of ENSO.16
John Houghton and others, eds., Climate Change 1995, The Science of Climate Change, Summary for Policy Makers, Intergovernmental Panel on Climate Change (Cambridge, MA: Cambridge University Press, 1996), 167-168.17
For example, ongoing research by NASA's Mission to Earth program indicates there is correlation between ENSO and the duration of the North Atlantic ice season.18
John M. Collins, Military Geography: For Professionals and the Public (Washington, D.C.: National Defense University Press, 1998),101.19
John Houghton and others, Climate Change 1995, The Science of Climate Change, Summary for Policy Makers, Intergovernmental Panel on Climate Change (Cambridge, MA: Cambridge University Press, 1996), 378-379.